Graphics Debugging using RenderDoc
Graphics Debugging using RenderDoc
When working with 3D rendering you often run into various issues.
Here are some typical issues you might encounter:
- Nothing is rendered
- Part of a model looks wrong
- The colour is wrong
- A model looks distorted
- Low FPS
- Something just doesn’t look right (obscure graphics issues that don’t make sense)
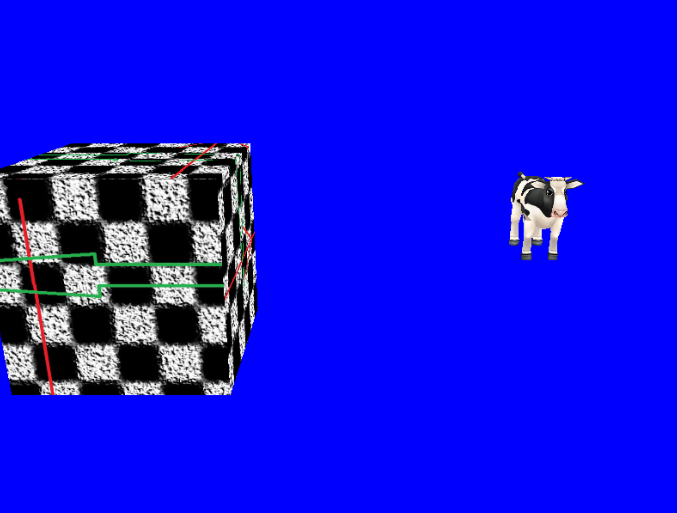
Sometimes the problem itself can give you some clues, and you will immediately know how to fix it.
Sometimes not…
↑ How do you fix this??
Graphics debugging tools
When you encounter a bug that just doesn’t make sense, using some graphics debugging tools can help you!
Using such tools allows you to:
- See the input and output of each draw call
- See the input meshes and compare them to the output of the vertex shader
- See all the constant buffers / uniforms (Unity: shader properties)
- See all the vertex data (positions, normals, UVs)
- See exactly what goes on in the fragment/pixel shader for one selected pixel
… and much more!
Today I will write about one such tool: RenderDoc! It has saved me many times.
RenderDoc
Link: https://renderdoc.org/
“RenderDoc is a free MIT licensed stand-alone graphics debugger that allows quick and easy single-frame capture and detailed introspection of any application using Vulkan, D3D11, OpenGL & OpenGL ES or D3D12 across Windows 7 – 10, Linux, Android, Stadia, or Nintendo Switch™.”
Using RenderDoc, you can capture a frame from a running application, and look at everything that happens during the frame. You can see the input/output textures of each draw call, see the intput/output of each shader, see which graphics API calls have been executed, inspect your shader resources, and much more!
Using RenderDoc to debug a released software
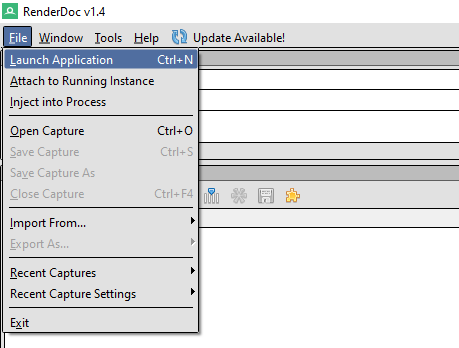
First, click “File” and “Launch Application”
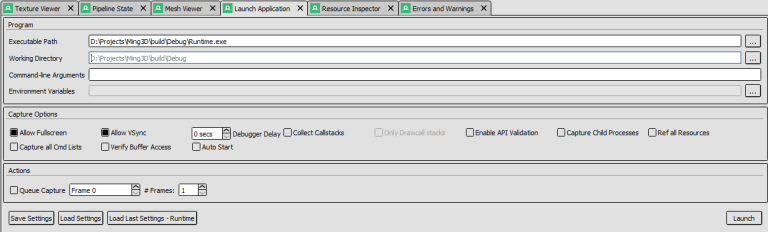
Then, select an “Executable Path” (and optionally a working dictionary) and click “Launch”
If everything works, you will see an overlay.
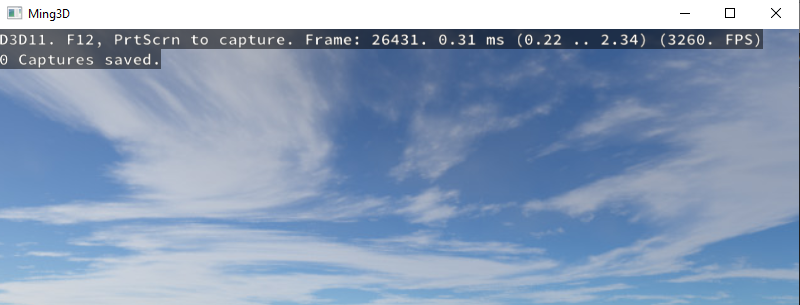
Press PrintScreen to capture a frame.
Using RenderDoc with the Unity Editor
Unity has integrated support for making captures with RenderDoc: https://docs.unity3d.com/Manual/RenderDocIntegration.html
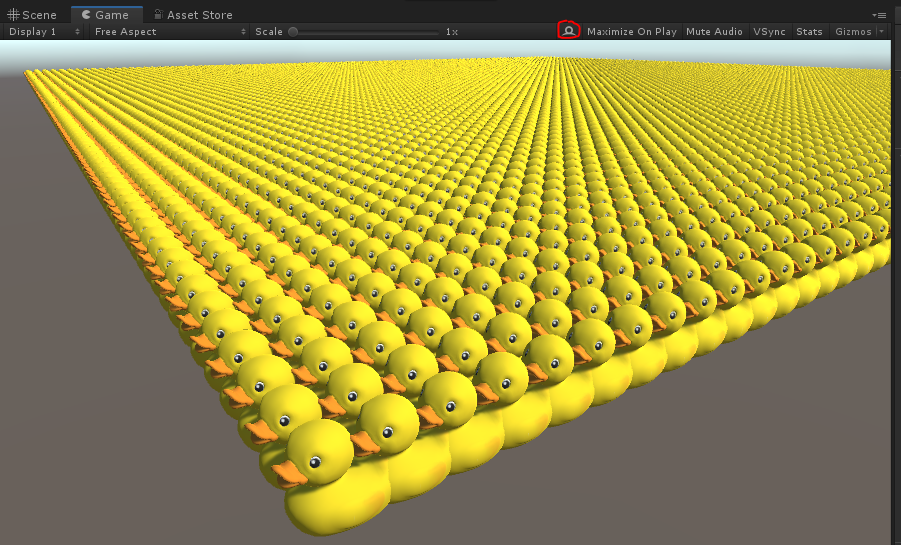
To capture a frame, simply press the RenderDoc icon above the game view. Note: You need to load renderdoc first.
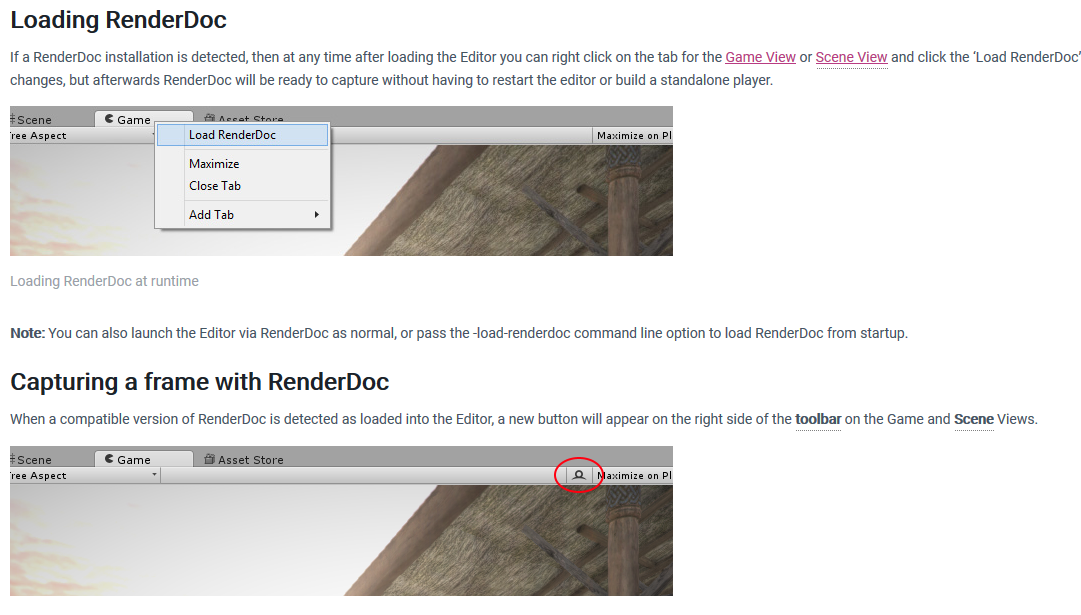
(from Unity’s documentation)
Example
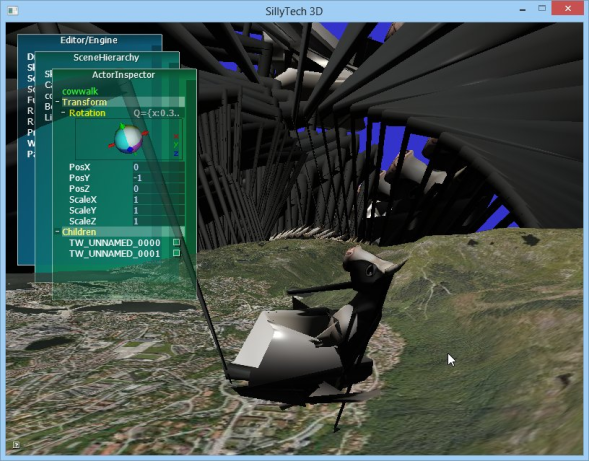
This is a typical scene seen in most games.
Let’s take a capture and inspect it with RenderDoc.
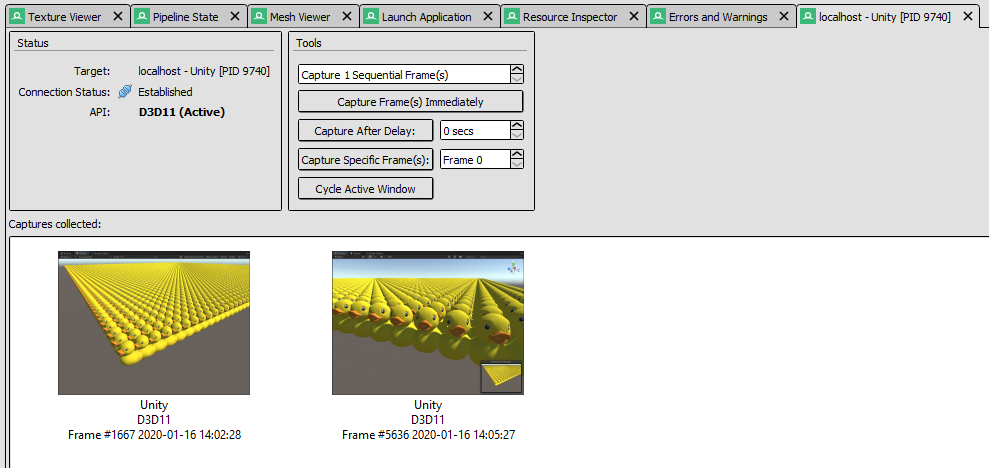
After taking the capture, RenderDoc will open. Here I double-click on the capture I want to use.
Event browser
The event browser shows all rendering events / draw calls.
The names and hierarchies depend on the software you are debugging. In the case of Unity, it will be different when capturing a release build or editor game view or scene view.
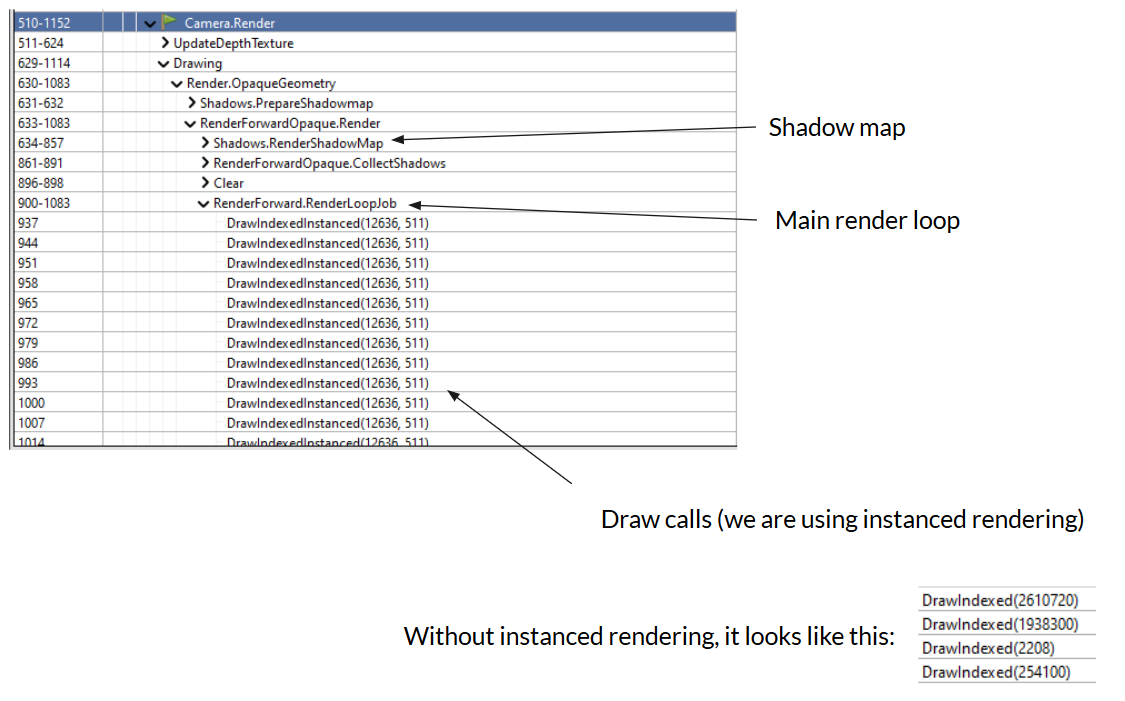
In the case of Unity, we are normally most interested in “Camera.Render”
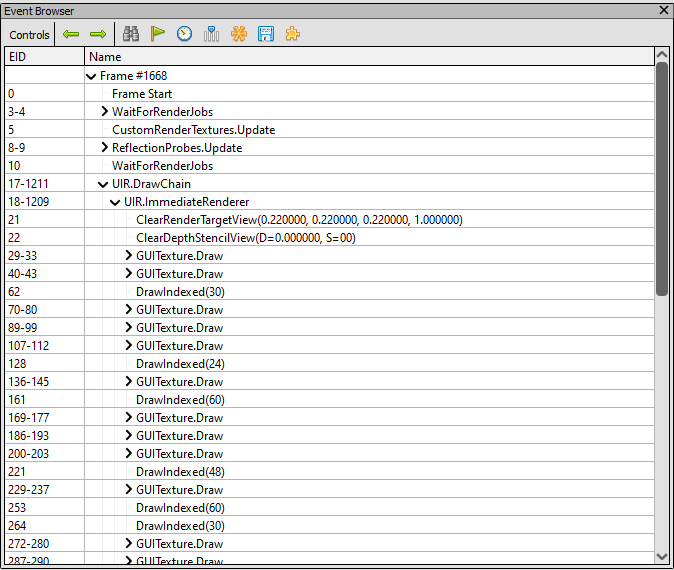
We see in the event browser that Unity does several passes, such as shadow map and the main forward (opaque) render loop.
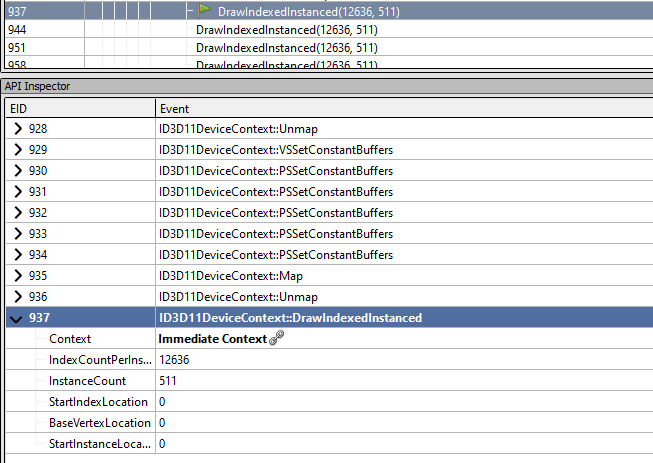
If you select an event, the “API Inspector” will show all relevant rendering API calls, such as vertex buffer creation, constant buffer set calls, etc.
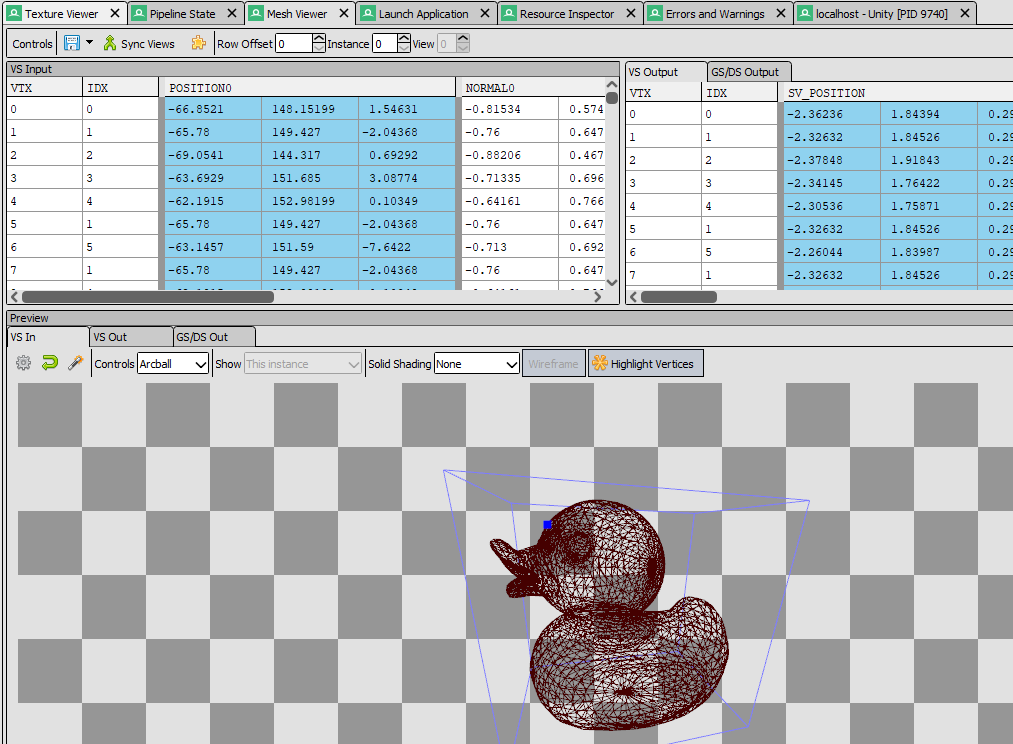
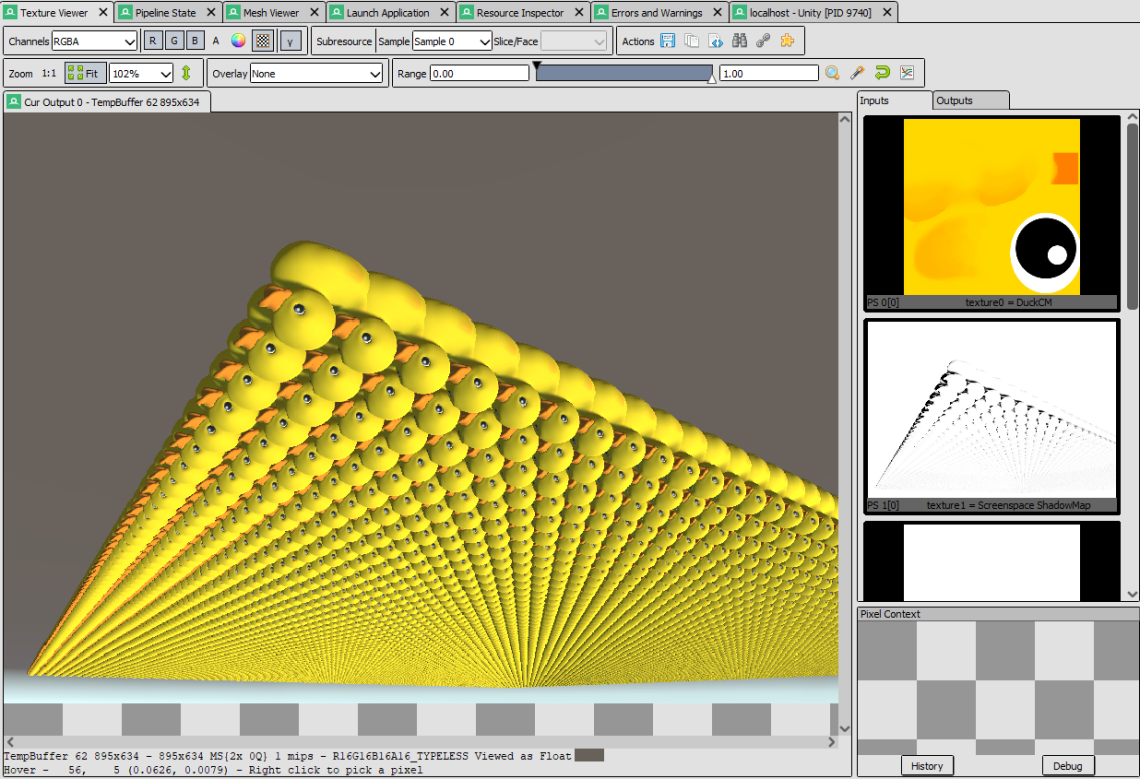
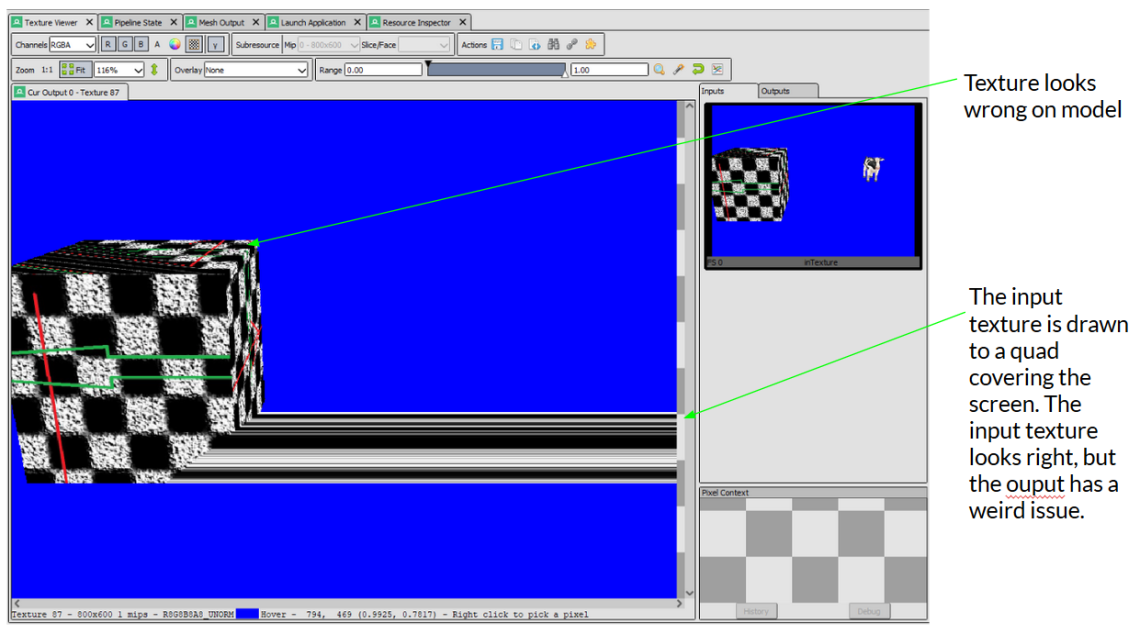
Texture Viewer
In the Texture Viewer you can see all input/output textures
Mesh Viewer
The Mesh Viewer shows you the input and output vertices of the vertex shader

If a model looks distorted or has other vertex-related issues, this is a good place to start.
Things to check:
- Are the input vertices correct? (if not, it might be a model-import related issue)
- Are the output vertices correct? (If not, the issue occurs in the vertex shader)
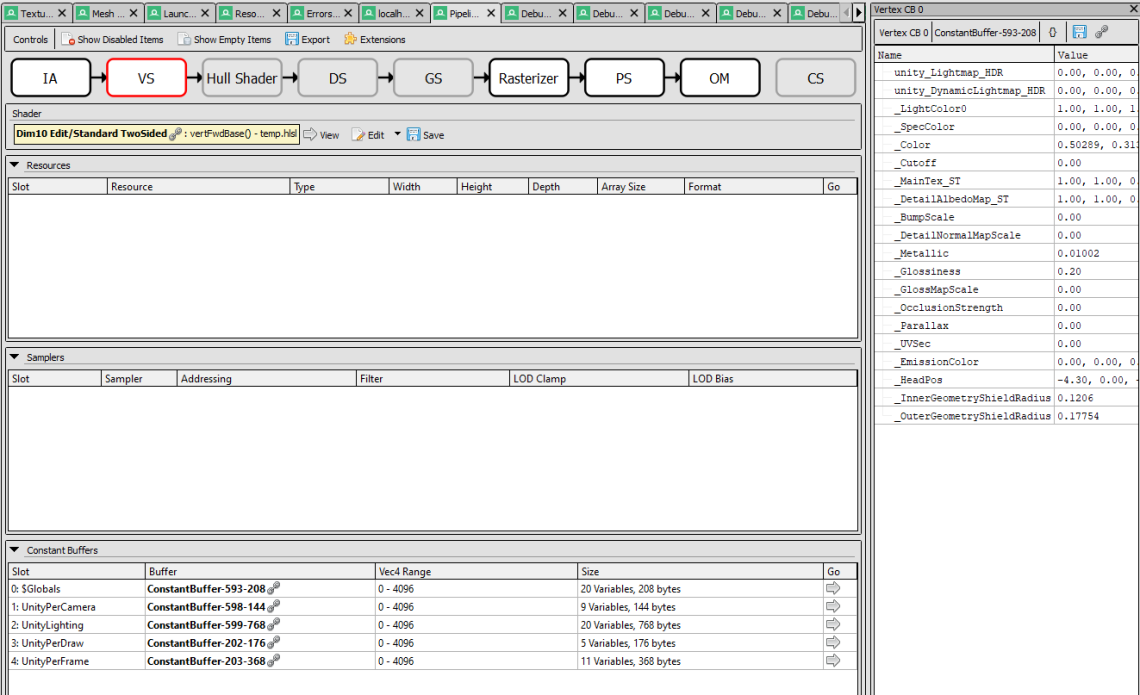
Pipeline State
The Pipeline State window shows you what happens in each stage of the pipeline
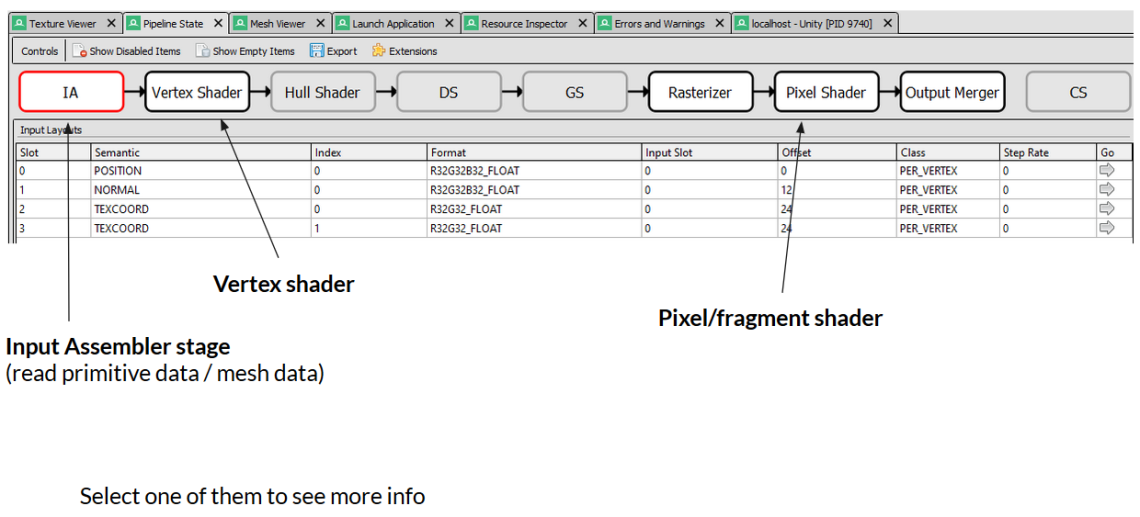
Selecting VS(Vertex Shader) or PS (Pixel shader) will allow you to check the constant buffers (material properties)
NOTE: to see the names of the material properties (in Unity) you need to add this to your shader: #pragma enable_d3d11_debug_symbols
See: https://docs.unity3d.com/Manual/SL-DebuggingD3D11ShadersWithVS.html
Debugging checklist
- The mesh looks wrong
- Use the Mesh Viewer:
- Input mesh looks wrong => the input data is bad (maybe caused by a problem in the model or import)
- Input mesh looks right, but output looks bad => something wrong happens in the vertex shader
- Are your input matrices right? (select “VS” in the “Pipeline State” window and check the constant buffers). Also check your vertex shader.
- Use the Mesh Viewer:
- The colours are wrong
- Use the “Texture viewer” and check that the input textures are right.
- Check your UV coordinates and normals in the “Mesh Viewer”
- Select “PS” in the “Pipeline State” window and check the constant buffers
- Nothing is rendered
- Use the “Event Browser” and “API Inspector” to check if anything is missing or done wrong.
- Check the “Errors and Warnings” window
- Poor performance
- Use the “Event Browser” and check if you are wasting time on something unintended.
- Did you accidentally add an extra camera?
- Use the “Statistics” window and “Resources” window. Do you have too many constant buffers? (too many materials)
- Use a profiling tool, like Nvidia Nsight: https://developer.nvidia.com/nsight-graphics
- Use the “Event Browser” and check if you are wasting time on something unintended.
Example use cases
I’ll now look at some real-world use cases, where RenderDoc helped me track down some issues.
Case 1: Missing geometry
I was asked to look at an issue at work a while ago. A model had some geometry where a few faces were missing.
Here is an illustration of the issue:
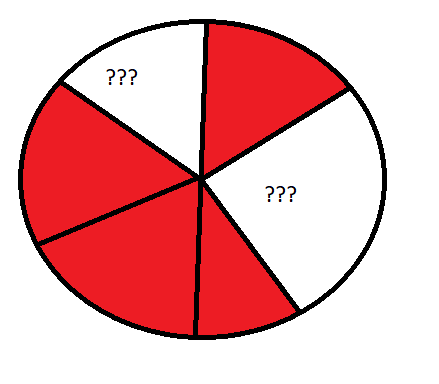
This is supposed to be a tube. However, some faces are missing. The faces are marked in red, and the white area shows where it’s missing geometry.
Possible causes:
- The model is wrong
- The model is right, but something wrong happens in the vertex shader.
Mesh Viewer
As you can see, the faces are also missing here (I have selected “Solid colour” shading to show all faces). However, I can see some lines where the missing geometry should be. Certainly I am not doing line rendering, so what could this be?
Since the input mesh is wrong, the issue is not rendering-related. I could check the model importer, but I don’t want to manually check 3 million vertices to look for issues.
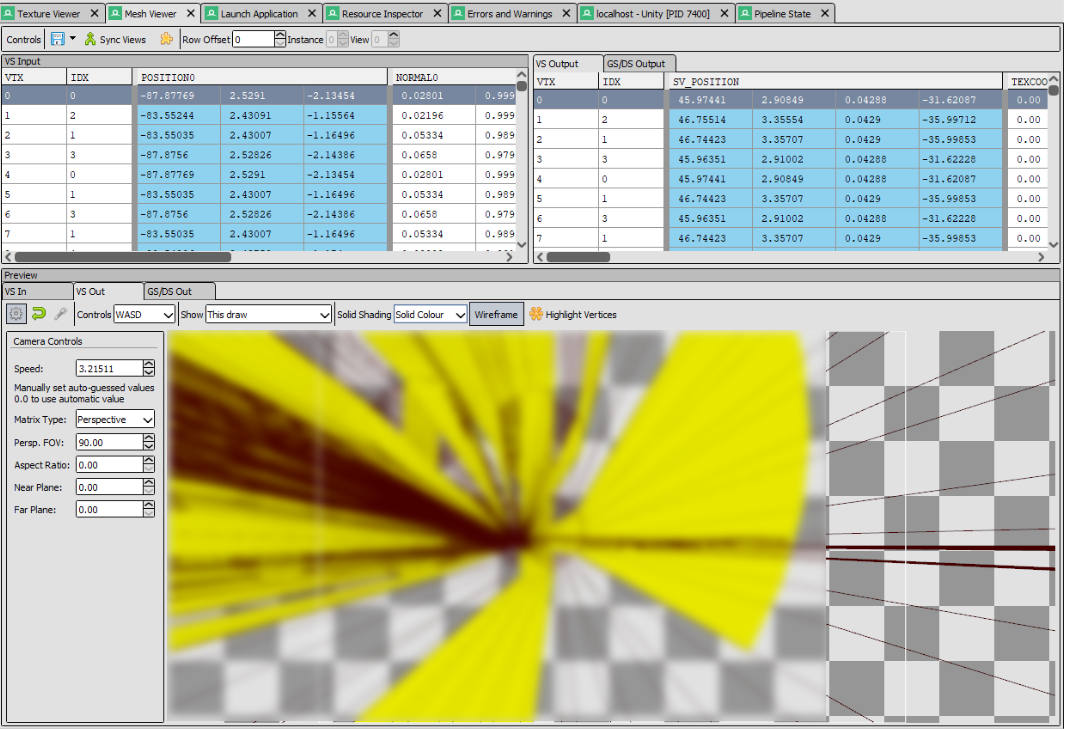
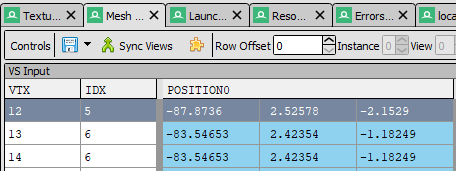
So I tried selecting one of the vertices near the missing geometry (you can click to select a vertex), and found a set of vertices that did not make a proper triangle (12, 13, 14). These 3 vertices are supposed to be connected as one triangle.
Looking at the index numbers (“IDX”) I see that the triangle consists of the vertices: 5,6,6. In other words, it’s a triangle where two of the vertices are the same! That’s not intended.
What we know so far:
- We know the issue occurs before rendering
- We know which mesh it happens to
- We know which vertices (and their IDs) it happens to
I start by looking in our model importer. Since I know the mesh and vertex IDs (and indices), I am able to find these vertices by adding a breakpoint, but the indices are different: 8,9,10

However, after a few functions are called, they change!
Recognise these indices? (5,6,6). It’s our missing triangle.
This happens after this function gets called:

Apparently there was a problem with how that function calculated the distance between two vertices.
After fixing the issue, the model looks fine!
What we can learn from this:
Without RenderDoc or a similar software, this would have taken ma ages! Using RenderDoc I was able to find out when the problem occurs (before rendering). I was also able to find the IDs of the vertices/indices of the missing geometry. Using all this information made it possible for me to track down the issue using a Debugger (in Visual Studio).
Case 2: Ming3D (my own 3D engine)
This case is taken from another of my blog bosts. You can see the whole post here: https://matiaslavik.wordpress.com/2019/03/16/debugging-rendering-code-with-renderdoc/
This is a job for the “Mesh View”!
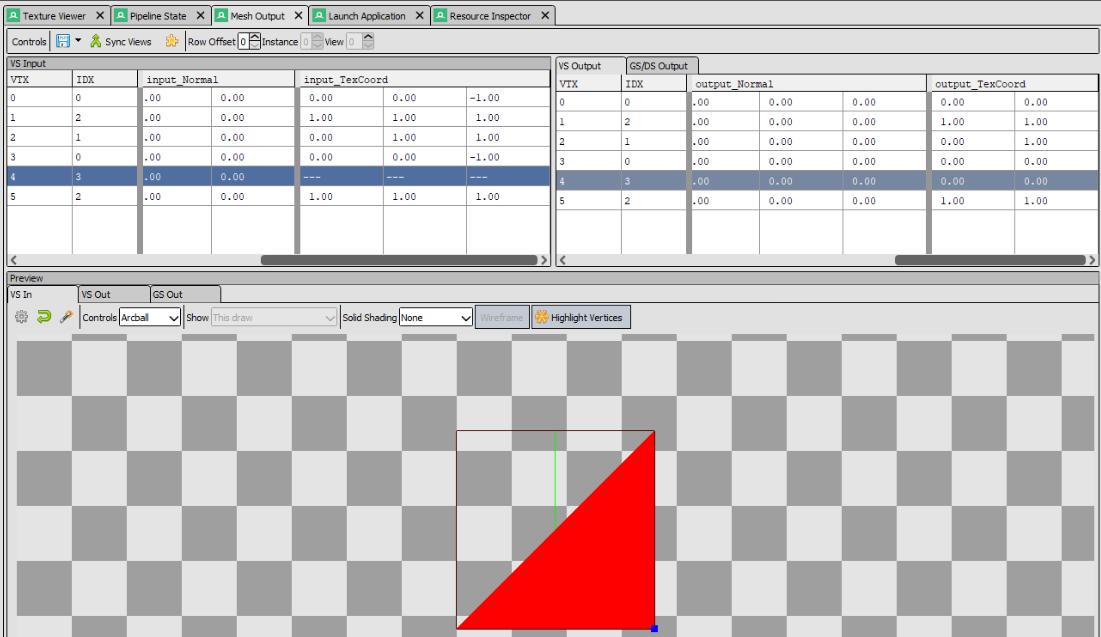
Here I have selected the screen space quad that the texture is rendered to. As you see the quad looks correct, but one of the tex coordinates has an invalid value “—”.
So rather than the coordinate being wrong, it’s invalid! Probably there must be an issue with how the vertex buffers are created (in the Engine).
This is where the draw call is issued:
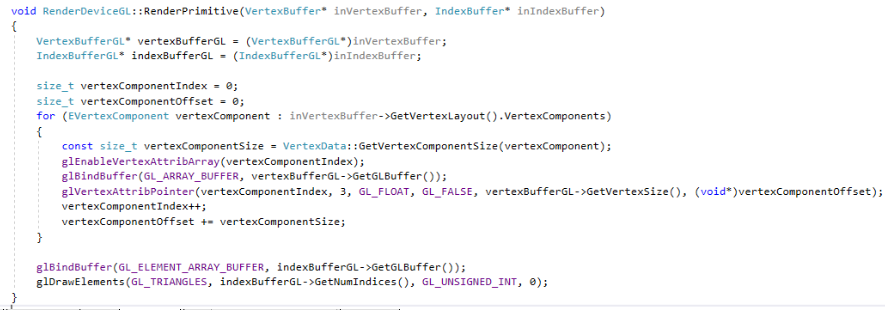
The “size” parameter of glVertexAttribPointer is hard-coded to “3”. Don’t ask me why. It should be “2” for 2D vectors (vec2).
Problem solved!
Case 3: How does Unity Editor render shaded wireframe?
Another good use case for RenderDoc is to gain insight into how a software/game renders a frame.
This can be useful for educational purposes, but also if you want to do something another software does, but don’t know how to do it.
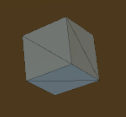
This is how a cube looks in Unity’s scene view with shaded wireframe mode enabled:
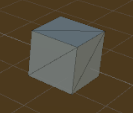
As you can see, the box has normal shading with a wireframe.
There are many ways of doing wireframe rendering. I wanted to know how the Unity Editor renders “shaded wireframe”. So I made a capture from the scene view.
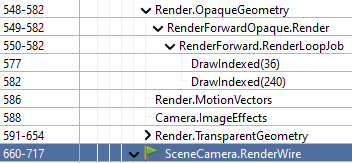
There are two passes here: “Render.OpaqueGeometry” and “SceneCamera.RenderWire”.
Render.OpaqueGeometry output:
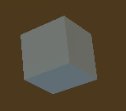
SceneCamera.RenderWire output:
So apparently Unity first renders the box, and then it renders a wireframe on top of the box.
But how does it do the second wireframe-pass? Is it done through a shader? Or is it a rasterizer setting? (note: the “rasterizer” stage turns vertices/triangles into pixels, by filling. Eit can either do “solid” filling and fill all pixels inside a triangle, or it can use wireframe fill mode).
So open the “Pipeline State” window and check the “Rasterizer” State.
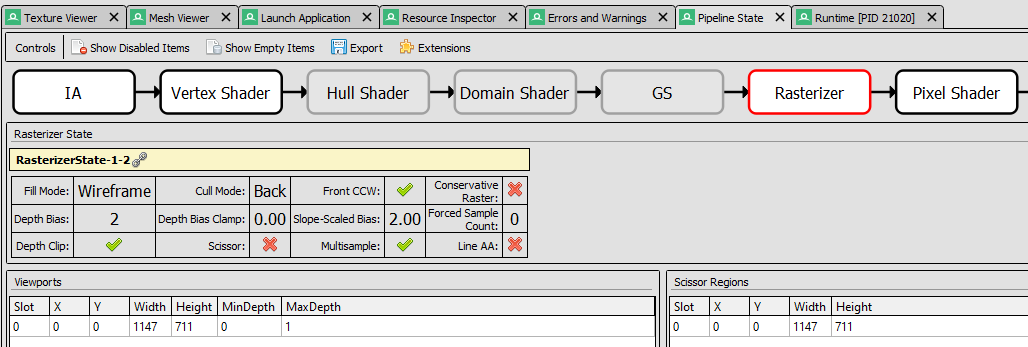
It says “Fill Mode: Wireframe”
If I want to see exactly how it does this, I can select the first draw call in the “RenderWire” pass, then find “RSSetState” and open up the rasterizer state.
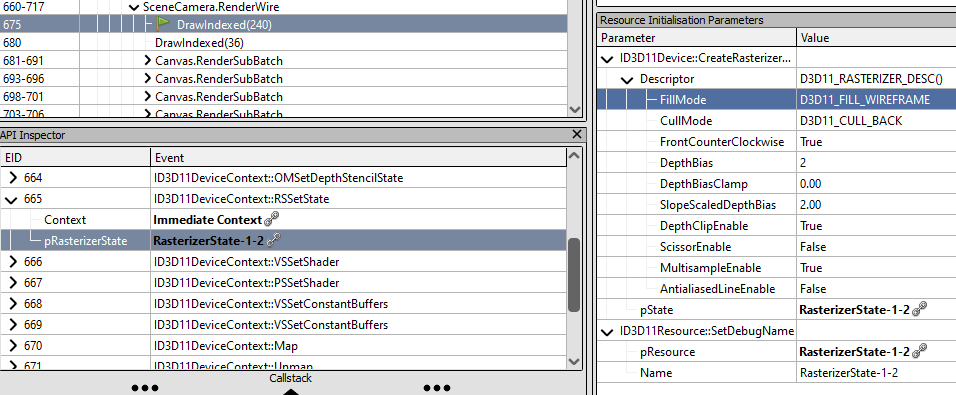
It’s using D3D11_FILL_WIREFRAME as fill mode.
See: https://docs.microsoft.com/en-us/windows/win32/api/d3d11/ns-d3d11-d3d11_rasterizer_desc
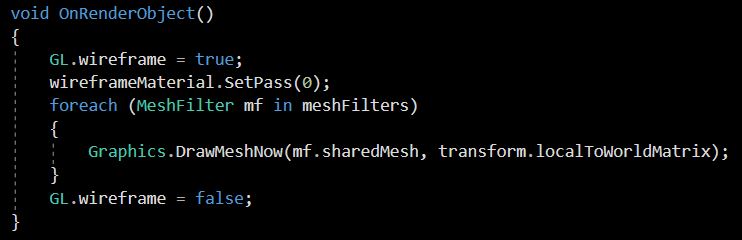
If you want to create the same effect in your own Unity project, you can create a script which implements void OnRenderObject(), and do the following:
Other tools
Nvidia Nsight
https://developer.nvidia.com/nsight-graphics
Features:
- GPU trace
- Performance metrics
- Helps you find out where the bottleneck is
- C++ capture export
- Create a self-contained C++ project that allows for frame analysis in a reduced CPU-load scenario, without requiring the original application
- Pixel history
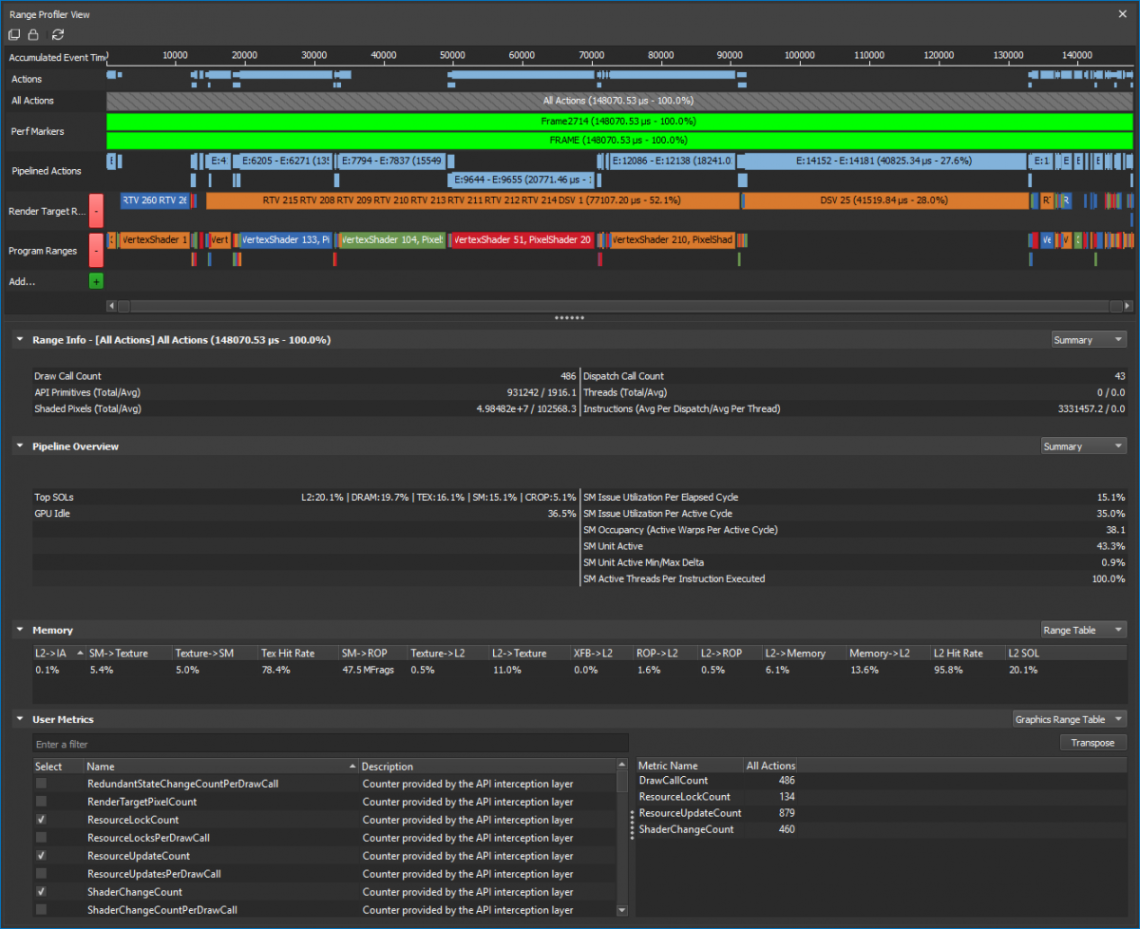
Nsight’s Range Profiler is a powerful tool that can give you detailed information on what the GPU is doing and where most of the time is spent (where your bottleneck is).
To understand the metrics you need to know a little bit about what goes on inside the GPU. This article explains it very well: https://developer.nvidia.com/content/life-triangle-nvidias-logical-pipeline
Next, you should read this article about how to use the Range Profiler and how to interpret the data: https://devblogs.nvidia.com/the-peak-performance-analysis-method-for-optimizing-any-gpu-workload/
If you are new to this, it might be tough reading, but believe me – it will definitely pay off!
Brief explanation:
SOL(“Speed of Light”) is a metric for how close each unit is to its maximum theoretical throughput. The “top SOLs” shows which hardware units are limiting your performance the most. If the top SOL is high (>80%) then the unit is performing well, and possibly has too much to do. In that case you need to remove some workload (exactly what depends on which unit it is). If the top SOL is low (<60%) it’s under-utilised, and you need to find out what is limiting it.
Read more about this in the two articles above. The second article has step-by-step guides for profiling and some examples, so you might even be able to use Nsight without fully understanding all the metrics.
Further reading
- Debugging rendering code with RenderDoc: https://matiaslavik.wordpress.com/2019/03/16/debugging-rendering-code-with-renderdoc/
- Life of a triangle – NVIDIA’s logical pipeline: https://developer.nvidia.com/content/life-triangle-nvidias-logical-pipeline
- The Peak-Performance-Percentage Analysis Method for Optimizing Any GPU Workload: https://devblogs.nvidia.com/the-peak-performance-analysis-method-for-optimizing-any-gpu-workload/
Sharing is caring!