Debugging using Visual Studio’s disassembly window
Debugging using Visual Studio’s disassembly window
If you have experienced debugging live versions of a game or software (built with optimisations) you have probably found yourself in case s where you want to inspect or modify a variable, but not been able to do so because it has been optimised away. When you hover over it with the mouse you cannot see its value, and you see no obvious way to change its value.However, this is not a dead end. There are ways to modify variables that have been optimised away and are not inspectable when debugging.
I will start with a simple (and meaningless) example, and then move on to a real case where I needed to do this. I will use Debug and Release configuration to test with and without compiler optimisations. A released product will usually be built with optimisations (Release mode) and is then harder to debug.
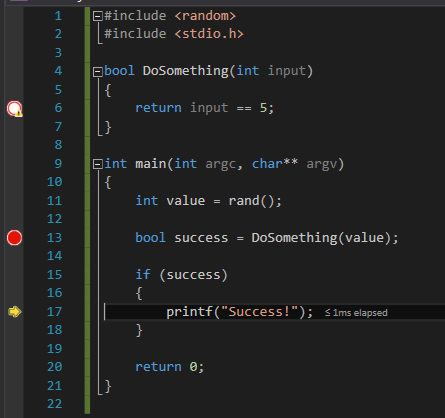
Simple example: (the function returns true if input is equal to 5)

Imagine that this is the source code of a shipped product. You are debugging a live version of it by attaching visual studio to the process, and you want to see what happens when the function DoSomething returns true (when the input equals 5). Since we are debugging a live version we need to force the function to return true by making sure the parameter passed into it is 5, without modifying the source code and re-building the project. If the above code is built in debug mode without compiler optimisations, this is fairly easy.

You can simply hover over the value variable and change its value to “5”, then the function will return true and success with be set to true.
However, if the executable was built with optimisations you will see something like this:

You will not be able to put a breakpoint inside the function, and the value variable has been optimised away, so you won’t be able to see or modify its value by hovering over it with the mouse. How can we now change the function parameter to make sure DoSomething returns true?
We can use the disassembly window.
While the application is running with visual studio attached, open “Debug”»“Windows”»“Disassembly”:

In this window you will see the assembly code, together with some hints to which lines in the source code they belong to. We are looking for some instructions that compare a value (either from memory or a processor register) with the value 5. We find cmp eax,5.

The cmp instruction subtracts the two values and sets the Zero Flag if the result is zero, and is often used for conditional jumps (if statements in c++). The above instruction compares the value in the eax register with the value 5. We can therefore conclude that the input parameter passed to the function is stored in the eax register, so if we change its value to 5 we can make the function return true. We can do that by writing EAX = 5 in the immediate window or watch window.
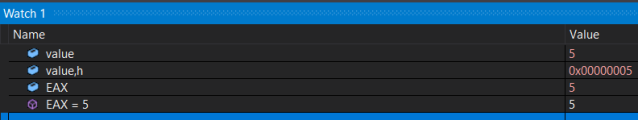
We then switch back to the source code window and press F10.
The function returned true, and we end up printing the text. Mission acomplished!
A real example
This is an example based on a problem I ran into at work once. I was debugging a released version of a project. Whenever the application crashes it optionally saves a crashdump with full heap memory, but there was an issue where the crashdumps sometimes became invalid.
I started the application, attached visual studio to the process (Debug»Attach to process – or Ctrl+Alt+P) and triggered a crash. I had added a breakpoint to the function that created the crashdump and looked at what happened there. The Windows API function MiniDumpWriteDump was called, but it returned FALSE and the following call to GetLastError() returned ERROR_PARTIAL_COPY(“Only part of ReadProcessMemory or WriteProcessMemory request was completed”). After some searching, I decided to test if adding MiniDumpIgnoreInaccessibleMemory to the DumpType parameter (which should make the function ignore memory read failures and continue to generate the dump). However, doing the change in code and re-building the application would take a long time, and for some reason I was not able to reproduce the issue in my own build. So the easiest solution would be to test it with the debugger attached to the already running process.

What I want to do is to add MiniDumpIgnoreInaccessibleMemory to the dumpType variable, before the function is called. I added a breakpoint to the second line (where MiniDumpWriteDump gets called) and checked if it was possible to modify the variable directly, but I could not see its value by hovering over it with the mouse, and printing it form the immediate window gave me this error:

So it had been optimised away. I decided to open the disassembly window and look for the value there. We are looking for the value:
MiniDumpWithFullMemory|MiniDumpWithFullMemoryInfo|MiniDumpWithThreadInfo
I tried printing its value in the watch window, and got the value 6146 (0x00001802 in hex – visible by adding “,h” at the end):
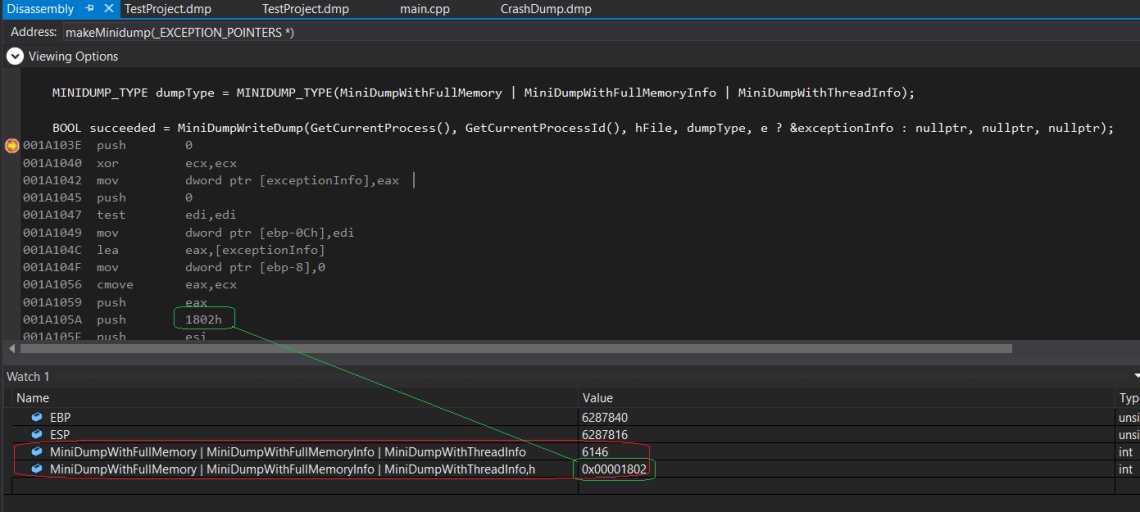
We are looking for the value 6146 (0x00001802), and find the instruction push 1802h. The PUSH instruction decrements the stack pointer and pushes a value onto the stack. In practise, this means storing the value in the location pointed to by the ESP register and decrementing the value of the ESP register. We press F10 until we arrive at the “push 1802” line:
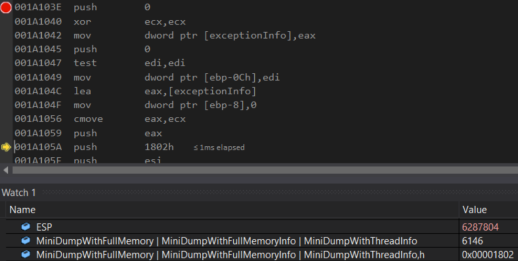
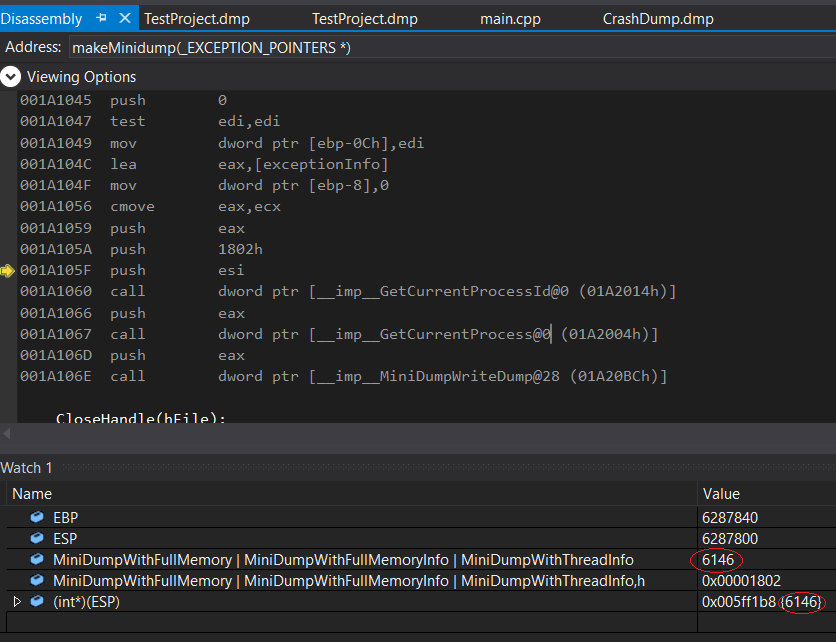
The ESP register’s value is now 6287804. If we press F10 again, and jump to the next instruction (after we have pushed 1802 onto the stack) we get:

The value of the ESP register has now been decremented. If we print the value of the ESP register as an int pointer, we get this:

It is 6146, which is exactly the same as the value of the parameters (marked in red). We now need to change this to the desired value.
I see from microsoft’s documentation that MiniDumpWithTokenInformation equals 0x00040000, so I type into the immediate window: 6146 | 0x00040000 which prints “268290”, which is the value we want to pass to the function.
I change it in memory by setting the value pointed to by ESP like this:

We have now successfully changed added MiniDumpIgnoreInaccessibleMemory to the DumpType parameter! This is how I solved the problem that this example is based on. After changing the DumpType parameter, a valid crashdump was successfully generated.
This is the source code for my example.
#include <Windows.h>
#include <DbgHelp.h>

void makeMinidump(EXCEPTION_POINTERS* e)
{
	HANDLE hFile = CreateFile("CrashDump.dmp", GENERIC_WRITE, FILE_SHARE_READ, 0, CREATE_ALWAYS, FILE_ATTRIBUTE_NORMAL, 0);
	if (hFile == INVALID_HANDLE_VALUE)
	{
		return;
	}

	MINIDUMP_EXCEPTION_INFORMATION exceptionInfo;
	exceptionInfo.ThreadId = GetCurrentThreadId();
	exceptionInfo.ExceptionPointers = e;
	exceptionInfo.ClientPointers = FALSE;

	MINIDUMP_TYPE dumpType = MINIDUMP_TYPE(MiniDumpWithFullMemory | MiniDumpWithFullMemoryInfo | MiniDumpWithThreadInfo);

	BOOL succeeded = MiniDumpWriteDump(GetCurrentProcess(), GetCurrentProcessId(), hFile, dumpType, e ? &exceptionInfo : nullptr, nullptr, nullptr);

	CloseHandle(hFile);

	return;
}

int filterException(int code, PEXCEPTION_POINTERS ex)
{
	makeMinidump(ex);
	return EXCEPTION_EXECUTE_HANDLER;
}

int main()
{
	__try
	{
		int myInt = *(int*)nullptr;
		return myInt;
	}
	__except (filterException(GetExceptionCode(), GetExceptionInformation()))
	{
	}


	return 0;
}
Last words
Being familiar with processor registers and knowing some basic assembly (instructions like PUSH, JMP, JNE) can be very useful when debugging. If you don’t already have any experience with assembly, learning to program the NES console might be a good place to start. Here are some tutorials and a quick overview of NES assembly. The NES console’s processor (6502) is nothing like modern processors, but the basic concepts are the same. It has only a few processor registers and a small instruction set, so it’s less overwhelming and probably a good place to start.
Sharing is caring!